


You’re tracking open rates, click-through rates, and delivery metrics across email, SMS, and push. But without a clear sense of what good looks like across these channels, it’s hard to know whether your numbers represent a strong program or a missed opportunity.
That uncertainty leads to misallocated effort. Teams optimize the wrong metric, over-invest in channels that are already performing, or miss early warning signs like rising unsubscribe rates because they don’t have a benchmark to measure against. When each channel is evaluated in isolation, it’s hard to get the full picture of how your marketing strategies are actually performing.
This article gives you the reference points you need. We share directional omnichannel marketing benchmarks for email, SMS, and push in 2026, along with a practical framework for interpreting them and applying them within the lifecycle journeys where they matter most.
Drive Retention & Loyalty with the Power of Omnichannel Marketing

What Omnichannel Marketing Means in 2026
At its core, omnichannel marketing is the coordination of customer interactions across every channel through integrated data and orchestrated execution. That sounds straightforward enough, but the distinction between omnichannel and its predecessors matters more than many teams realize.
Here’s how to tell the models apart (for a deeper look, see our guide on multichannel vs omnichannel):
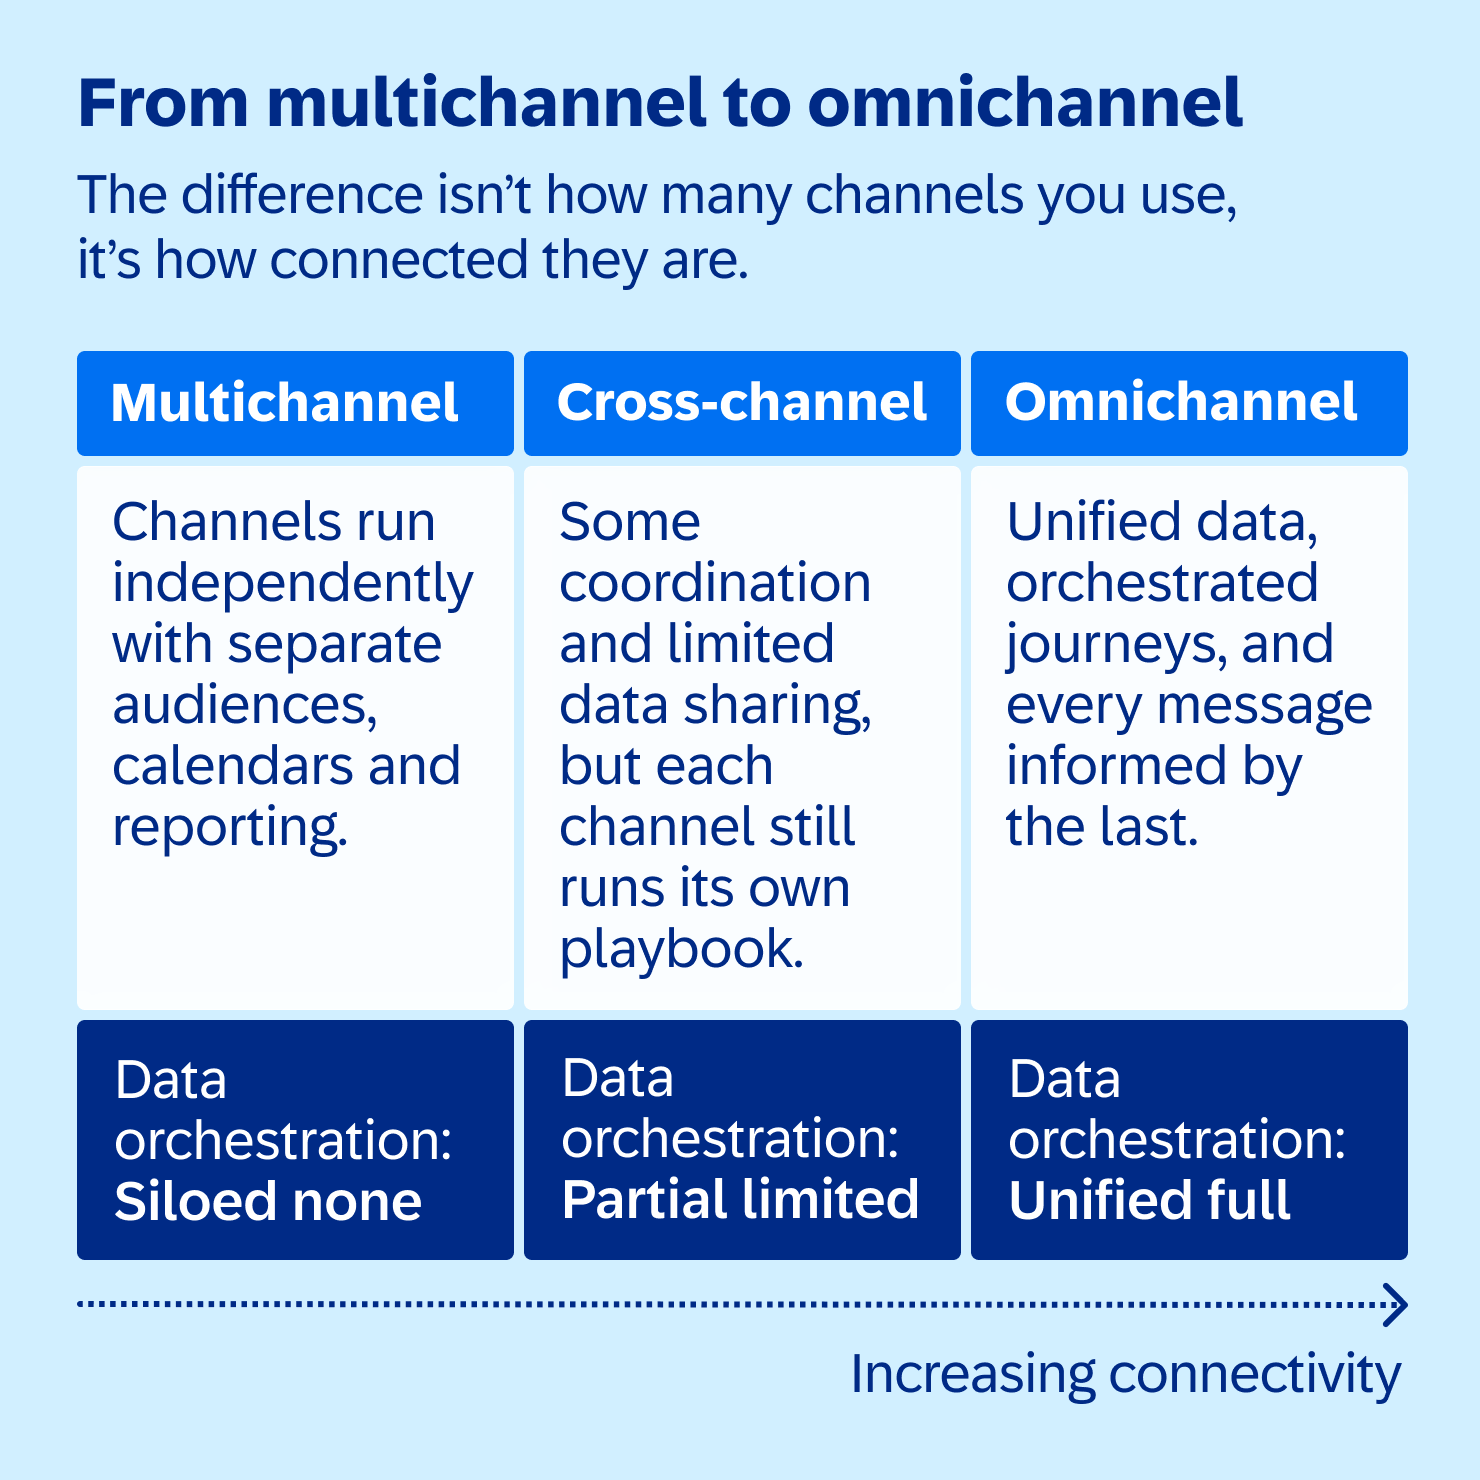
- Multichannel: Channels operate independently. Email, SMS, and push each have their own audience, calendar, and reporting. They may all be running, but they’re not talking to each other.
- Cross-channel: There’s some coordination and limited data sharing, but each channel still largely runs its own playbook.
- Omnichannel: Customer data is unified, journeys are orchestrated across channels, and every message is informed by what happened before it, regardless of which channel delivered it.
True omnichannel engagement depends on three core capabilities: unified customer data, intelligent insights, and coordinated orchestration across channels.
Unified customer data creates a single, continuously updated view of each customer by connecting behavioral, transactional, and engagement data across systems and touchpoints.
Intelligent insights transform that data into actionable understanding. Predictive analytics, segmentation, and lifecycle intelligence help marketers identify intent, anticipate needs, and determine the next best action.
Coordinated orchestration ensures that messages are delivered in the right order and at the right moment across channels like email, SMS, push, web, and advertising. Each interaction builds on the previous one, creating experiences that feel consistent and relevant.
When these capabilities work together, brands can move beyond isolated campaigns and deliver engagement that evolves with the customer. Without them, marketing activity may span multiple channels, but the experience still feels fragmented.
Are you actually omnichannel?
Here’s a quick diagnostic. Be honest with yourself:
- Customer data is unified into a single profile across email, SMS, push, web, and commerce.
- Identity resolution connects the same customer across devices and sessions.
- Journeys are orchestrated across channels with coordinated timing and suppression rules.
- Segments update dynamically based on behavior.
- Reporting measures cross-channel journey impact rather than isolated channel metrics.
- Engagement performance can be tied to downstream conversion and revenue.
If fewer than half of these apply, your organization is likely operating in a multichannel model rather than a true omnichannel framework. Knowing where you stand makes the benchmarks that follow far more useful.
Build your omnichannel strategy from the ground up
Our comprehensive guide covers everything from data unification to journey orchestration, with practical steps you can start implementing today.
The Omnichannel Benchmark Framework
Before diving into channel-specific numbers, it helps to understand the structure behind them. Omnichannel marketing benchmarks vs industry benchmarks aren’t one-size-fits-all, and the most useful way to interpret them is through a three-layer framework:
Layer 1: Deliverability and permission. This is the foundation. Metrics here include delivery rate (the percentage of messages that successfully reach the inbox or device) and opt-in rate (the percentage of your audience that has actively consented to receive messages). If this layer is weak, nothing downstream will perform.
Layer 2: Engagement. This is where most benchmarking conversations start, and where the most familiar metrics live. Open rate measures how many recipients opened a message. Unique open rate counts each recipient only once. Click-through rate (CTR) measures clicks as a percentage of delivered messages. Unique CTR counts each clicker once. Click-to-open rate (CTOR) measures clicks as a percentage of opens, revealing content effectiveness. For push, direct open rate measures taps on the notification itself.
Layer 3: Downstream conversion and revenue. This is where benchmarks become business outcomes. Metrics here include conversion rate, revenue per message, and journey-level attribution. Channels that look average on engagement can still outperform when measured at this layer.
A note on measurement pitfalls
Before we review the benchmarks below, it’s important to understand how certain metrics can be distorted:
- Email open rates are affected by Apple Mail Privacy Protection, which automatically preloads images and records messages as opened. As a result, reported open rates are often higher than actual customer engagement.
- Click-through rate (CTR) can also vary depending on how platforms calculate clicks. Some measure total clicks, while others focus on unique clicks, and automated bot activity can occasionally inflate results.
- Push notification metrics come with their own limitations. “Direct open” typically measures whether a user tapped the notification itself. However, many customers still see the message and later open the app independently, which means the influence of the notification may not always be fully reflected in that metric.
For omnichannel marketers, the most meaningful indicators of engagement tend to be click-through rate (CTR), click-to-open rate (CTOR), and downstream revenue. These metrics provide a clearer picture of whether messages are driving meaningful customer action, rather than simply being delivered or displayed.
2026 Email Benchmark Metrics
The benchmarks below come from the DMA Email Benchmarking Report 2025, produced in partnership with seven major email service providers, including SAP Engagement Cloud. The dataset covers more than 442 billion emails sent in 2024 across B2B, B2C, and multiple industry sectors.
| Metric | B2B | B2C | Utilities | Retail | Travel |
|---|---|---|---|---|---|
| Delivery rate (2024) | 90.7% | 99.2% | 97.7% | 99.5% | 99.3% |
| Delivery rate change (YoY) | ▼ -1.4 pts | ▲ +0.7 pts | ▼ -0.4 pts | ▲ +0.2 pts | — |
| Open rate (2024) | 37.4% | 40.0% | 52.4% | 38.2% | 32.8% |
| Open rate change (YoY) | ▲ +3.8 pts | ▲ +3.7 pts | ▲ +9.5 pts | ▲ +4.5 pts | ▼ -0.7 pts |
| Click rate (2024) | 2.9% | 2.1% | 5.9% | 2.0% | 1.4% |
| Click rate change (YoY) | ▲ +1.5 pts | ▲ +0.4 pts | ▲ +0.5 pts | ▲ +0.8 pts | ▼ -0.2 pts |
| Click-to-open rate (2024) | 13.0% | 5.5% | 11.2% | 5.3% | 4.2% |
| Click-to-open rate change (YoY) | ▲ +8.2 pts | ▲ +1.2 pts | ▼ -0.8 pts | ▲ +1.8 pts | ▼ -0.6 pts |
How to interpret email benchmarks
The numbers above only become useful when you treat them as diagnostic signals rather than targets. Here’s how to read common patterns:
- Low open rate: This typically signals a list quality issue, a deliverability problem, or poor targeting. Check your sender reputation, authentication (SPF, DKIM, DMARC), and whether you’re sending to genuinely engaged contacts.
- High open rate, low CTR: Your subject line and timing are working, but the content or offer isn’t compelling enough to drive action. Look at your creative, your call-to-action clarity, and whether your message matches subscriber expectations.
- Rising unsubscribe rate: If unsubscribes are climbing alongside increased send volume, your audience is telling you they’re getting too many messages, or not enough relevant ones.
Email continues to perform particularly well at lifecycle moments where context and timing intersect. Welcome sequences, nurture programs, abandoned cart recovery, post-purchase education, and win-back campaigns often generate the strongest engagement.
If your strategy is still heavily campaign-led, shifting even a portion of volume toward triggered lifecycle journeys can significantly improve your performance against these benchmarks.
2026 SMS Benchmarks
| Metric | Directional range |
|---|---|
| Open rate | 90–98% |
| Click-through rate (CTR) | 10–30% |
| Unique CTR | 8–25% |
| Unsubscribe rate | 0.3–1.5% |
| Delivery rate | 95–99% |
SMS performance varies significantly by opt-in quality and purchase intent. A well-segmented list built from high-intent moments (checkout, loyalty enrollment) will dramatically outperform one built from passive sign-ups.
How to interpret SMS benchmarks
Here’s what to pay attention to when you’re reading your SMS data:
- Why SMS CTR outperforms email: Messages land directly on the lock screen with immediate visibility. SMS is device-native, requiring no app to open. And the format is short-form and action-driven, so the path from message to click is much shorter.
- Watch the unsubscribe threshold: An unsubscribe rate above 1% sustained over time is usually a warning sign. In most cases, this points to frequency fatigue, weak targeting, or a gap between what subscribers expected at opt-in and what they’re actually receiving. SMS subscribers are harder and more expensive to acquire than email subscribers, so protecting list health should always be a priority.
- Best-fit use cases: SMS performs best when speed and immediacy matter. Flash sales, time-sensitive reminders, transactional updates, and back-in-stock alerts are strong use cases because they deliver clear value in a concise format. The channel is less suited for long-form messaging or brand storytelling. Each message should feel purposeful and timely.
- Don’t overlook compliance: Respect quiet hours, maintain clear opt-out mechanisms, and make sure every message aligns with local regulations (TCPA in the US, GDPR in Europe). Compliance issues quickly erode trust and damage the long-term health of your opt-in audience.
|
Build your omnichannel strategy from the ground up Our comprehensive guide covers everything from data unification to journey orchestration, with practical steps you can start implementing today. |
2026 Push (Mobile and Web) Benchmarks
Push is the most variable channel in terms of benchmarks, because results depend heavily on app maturity, OS (Android vs. iOS), and the value exchange you offer at the opt-in prompt.
| Metric | Mobile app range | Web push range |
|---|---|---|
| Opt-in rate | 45–70% | 5–15% |
| Direct open rate | 4–6% | 5–12% |
| Influence rate | 15–30% | Varies widely |
| Unsubscribe / disable rate | 5–15% | 10–25% |
Note on direct open rates: Direct open rates for mobile app push can vary significantly by industry, app maturity, and audience size. Some brands, particularly those with large, established app bases, consistently see direct open rates in the 1–2% range, below the target above. This does not necessarily indicate underperformance. A lower direct open rate can coexist with a healthy influenced session rate, where users see the notification and open the app independently rather than tapping through directly. If your direct open rate sits below the target, check your influenced session data before drawing conclusions about push effectiveness.
Android devices still carry significantly higher opt-in rates than iOS, because iOS requires active consent while Android historically enabled notifications by default (though recent Android versions are shifting toward explicit opt-in too). Industry also plays a major role: finance and travel apps tend to see higher opt-in rates, while media and gaming sit lower.
How to interpret push benchmarks
Push measurement has some important nuances worth understanding:
- Direct open vs. influenced session vs. passive exposure: A direct open means the user tapped the notification. An influenced session means the user opened the app within a defined window after receiving it. Passive exposure means they saw it on their lock screen but took no trackable action. Direct open rates alone significantly understate push’s true impact.
- Where push works best: Activation, habit-building, re-engagement, and transactional nudges. It’s a behavioral reinforcement channel, not a promotional broadcast one. The brands seeing the strongest results use push to remind users of value they’ve already shown interest in, as opposed to leaning on batch-and-blast strategies.
- Protect your opt-in rate: This means clear preference management, frequency controls, and a visible value exchange. Users are sensitive to spam with push notifications, and once someone disables notifications, winning them back is extremely difficult. As a result, the best strategy is always quality over quantity.

How to Use Benchmarks to Build Omnichannel Journeys
This is where benchmarks stop being numbers on a dashboard and start shaping real customer experiences. Here’s how to apply benchmark thinking to three of the highest-impact lifecycle journeys:
New customer onboarding
Objective: Convert new opt-ins into a first purchase or first meaningful action.
The first 24 to 72 hours after a customer subscribes is often the highest-attention window you’ll see. This is the moment when expectations are forming and early engagement signals are strongest. Channel roles should be clearly defined:
- Email delivers the core welcome experience. Use it to introduce the brand, communicate value, and highlight key products or categories.
- SMS works well for activation nudges or incentive reminders, particularly when the subscriber opted in during a high-intent moment such as checkout.
- Push notifications can be used for preference capture or behavioral prompts once the customer installs the mobile app.
Suppression logic is critical. In your automation platform, once a customer completes a purchase or the defined onboarding goal, they should immediately exit the promotional portion of the journey. Continuing to send first-purchase incentives after conversion creates friction and weakens the experience.
Measurement focus: First purchase rate, time to first purchase, and cross-channel engagement. Successful onboarding journeys build momentum early rather than simply increasing send volume.
Abandoned cart recovery
Objective: Recover high-intent revenue while avoiding redundant messaging.
Cart abandonment journeys are one of the clearest examples of channel orchestration improving results. The right setup depends on where your customers abandoned and which channels they’re reachable on, and most brands will approach this differently depending on their tech stack and audience.
For brands with more mature automation setups, a split within an existing email journey works well:
- The primary flow runs on email
- Contacts who have the app installed are branched off and receive a push notification at a later touch, either instead of or alongside the follow-up email
A fully sequenced omnichannel cart recovery automation is also an option for brands with the suppression logic and audience segmentation to support it:
- Email at ~1 hour: product imagery, pricing context, and a clear path back to checkout
- Push at ~12-24 hours: a lightweight nudge for customers with the app installed
- SMS at ~24-36 hours (if no conversion): a concise reminder or limited-time incentive
This is a higher-complexity build and requires careful frequency controls to avoid the journey feeling like repeated pressure rather than a timely reminder.
Suppression logic is non-negotiable across all three models. Once a purchase event is recorded, contacts should exit the recovery flow immediately.
Measurement focus: Recovery rate, incremental revenue, and channel contribution. The goal is coordinated recovery across channels rather than repeating the same message multiple times.
Win-back and churn risk
Objective: Re-engage customers showing early signs of churn.
Effective win-back strategies rely on behavioral and predictive signals, not static calendar campaigns. Common churn signals include:
- No opens or clicks for 60 to 90 days
- Purchase gaps that exceed the customer’s normal buying cycle
- Declining engagement scores
Once these signals appear, a reactivation journey can be triggered. A typical omnichannel setup for win-back and churn automations is:
- Email delivers the primary re-engagement message, such as a targeted offer, content-driven value reminder, or curated recommendation.
- SMS should be reserved for higher-value customers and used sparingly, often paired with a time-bound incentive.
- Push notifications can encourage behavioral reactivation, such as revisiting the app or exploring new products.
Measurement focus: Reactivation rate, recovered revenue, and unsubscribe impact. A win-back program that increases churn elsewhere ultimately undermines long-term engagement.
Get the go-to Guide for Proven, High-Impact Omnichannel Marketing Tactics

Common Benchmark Mistakes
Even experienced omnichannel marketing teams fall into these traps. Spotting them early will save you from misallocating effort and drawing the wrong conclusions from your data:
- Comparing campaigns to triggered flows: These serve fundamentally different purposes and will always produce different metrics. Comparing them directly leads to either overconfidence in your automations or unfair pessimism about your campaigns.
- Ignoring deliverability and opt-in health: If 3% of your emails are bouncing and your opt-in rate is declining, improving subject lines won’t fix the underlying problem. Foundation metrics need attention before engagement metrics.
- Using blended benchmarks instead of segment-level targets: An overall CTR of 2.5% can mask a 5% CTR among your best segment and a 0.5% CTR among disengaged contacts. Segment-level analysis is where the actionable insights live.
- Over-messaging across channels: Sending an email, an SMS, and a push notification about the same promotion within two hours feels impersonal and can overwhelm your audience. Suppression rules and frequency caps are essential to protecting the customer experience.
- Evaluating channels independently rather than as journeys: Email might drive awareness, SMS might drive urgency, and push might drive the final conversion. If you evaluate each channel in isolation, you’ll undervalue every one of them.
| ✕ Don’t | ✓ Do instead |
|---|---|
| Compare campaigns to triggered flows | Benchmark each type against its own baseline |
| Ignore deliverability and opt-in health | Fix foundation metrics before optimizing engagement |
| Use blended benchmarks across all contacts | Set targets at the segment level |
| Send email + SMS + push within 2 hours | Use suppression rules and frequency caps |
| Evaluate each channel in isolation | Measure journey-level contribution across channels |
Turn Omnichannel Benchmarks into Performance Growth
Benchmarks are most useful when they function as diagnostic tools, not scorecards. The numbers in this article give you directional context, but the real performance gains come from how you act on them.
The pattern is consistent across every high-performing omnichannel program: unified customer data feeds intelligent orchestration, which delivers the right message on the right channel at the right moment. If your data is fragmented, your journeys will be too.
Start by identifying the one lifecycle journey where your benchmark gaps are widest, connect the relevant data sources, and build from there.
Omnichannel Marketing Benchmarks FAQs
Still got questions about omnichannel marketing benchmarks? Take a look at some of those commonly asked by other marketers:
Why is omnichannel marketing important?
Omnichannel marketing matters because customers interact with brands across multiple channels, and they expect a consistent experience throughout. When channels share data and coordinate messaging, brands reduce redundancy, improve relevance, and drive stronger downstream conversion and lifetime value compared to siloed channel strategies.
What is a good omnichannel engagement rate?
There’s no single “omnichannel engagement rate” because performance varies by channel, industry, and message type. A useful composite benchmark is a unique email CTR between 1 and 3%, an SMS CTR between 10 and 25%, and a push direct open rate between 3 and 8%. The more important measure is cross-channel journey conversion, not any single metric.
How do email, SMS, and push benchmarks compare?
Email delivers the broadest reach and lowest cost per message, with open rates of 35 to 45% and CTRs of 1.5 to 4%. SMS offers significantly higher attention and CTRs (10 to 30%) but at higher cost and stricter compliance requirements. Push sits between the two on attention but depends heavily on opt-in rates and is best suited for in-app behavioral reinforcement.
How often should omnichannel benchmarks be reviewed?
Review benchmarks quarterly at minimum, with monthly monitoring of leading indicators like deliverability, opt-in rates, and unsubscribe trends. Annual reviews are too infrequent because channel dynamics, privacy regulations, and audience behavior shift throughout the year. Triggered flow performance can be reviewed monthly; campaign benchmarks should track rolling 90-day trends.
What is the biggest mistake when using marketing benchmarks?
The most common mistake is treating benchmarks as targets rather than diagnostic signals. A 40% open rate isn’t inherently good, and a 2% CTR isn’t inherently bad. What matters is whether your metrics are trending in the right direction, whether they differ meaningfully across segments, and whether engagement translates to actual revenue and customer retention.